The development dashboard is a built-in Tapestry page that can help identify and resolve problems in your application.
The dashboard is typically only available to requests from localhost (the page is whitelist access only, see Security).
Some features of the dashboard are only available in development mode.
The dashboard is available via the URI "core/t5dashboard", or can be accessed by the DevTool component's dropdown menu.
By default, there are three tabs (this is extensible).
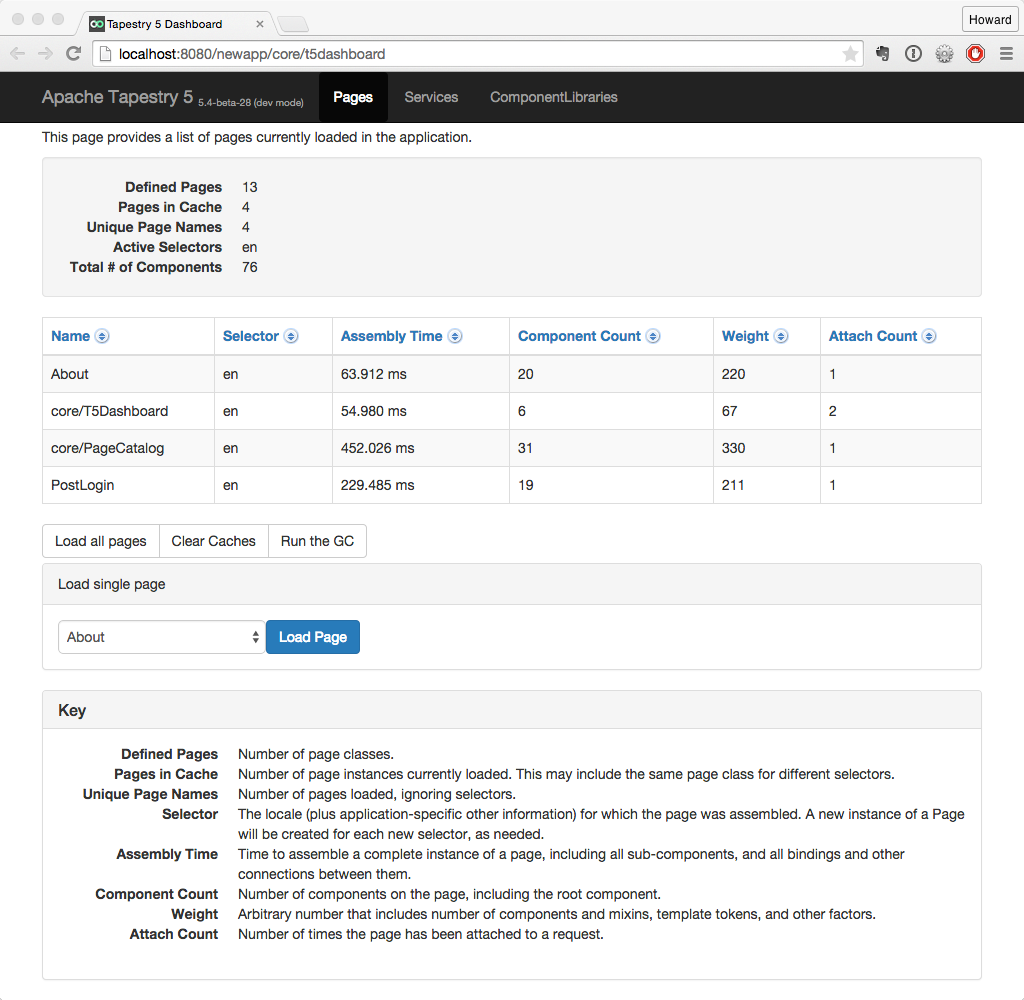
Pages
The pages tab shows what pages are currently loaded into the application. Tapestry only loads a page when it is first needed.
It is possible to clear out Tapestry's caches, forcing a reload. You can also run a garbage collection (GC).
It is possible to load any individual page, or attempt to load all pages. This can be a good way to see if all pages (and templates) are error free ... loading all will catch quite a few potential errors.
Services
When using Tapestry there will often be a large number of services defined in the registry; a mix of the built-in services provided by the framework and your own.
Services are usually only instantiated once they are needed.
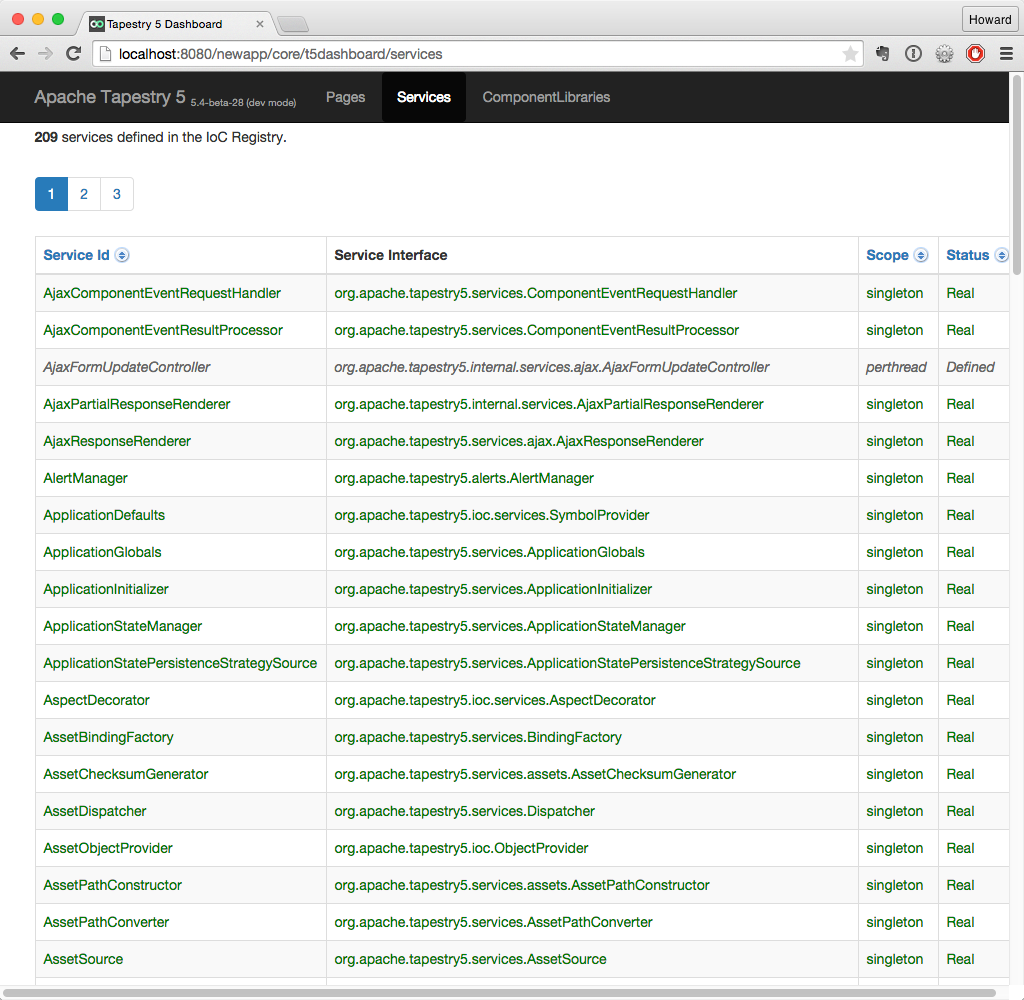
Services may be builtin, defined, virtual or real.
Builtin only applies to a few special services that are part of Tapestry IoC.
Defined services are defined in some module, but have not yet been referenced in any way.
Virtual services have been referenced and have gotten as far as creating a service proxy.
Real services have had methods invoked, this forces the realization of the service which includes instantiating the service, injecting dependencies, and decorating with any applicable interceptors.
Component Libraries
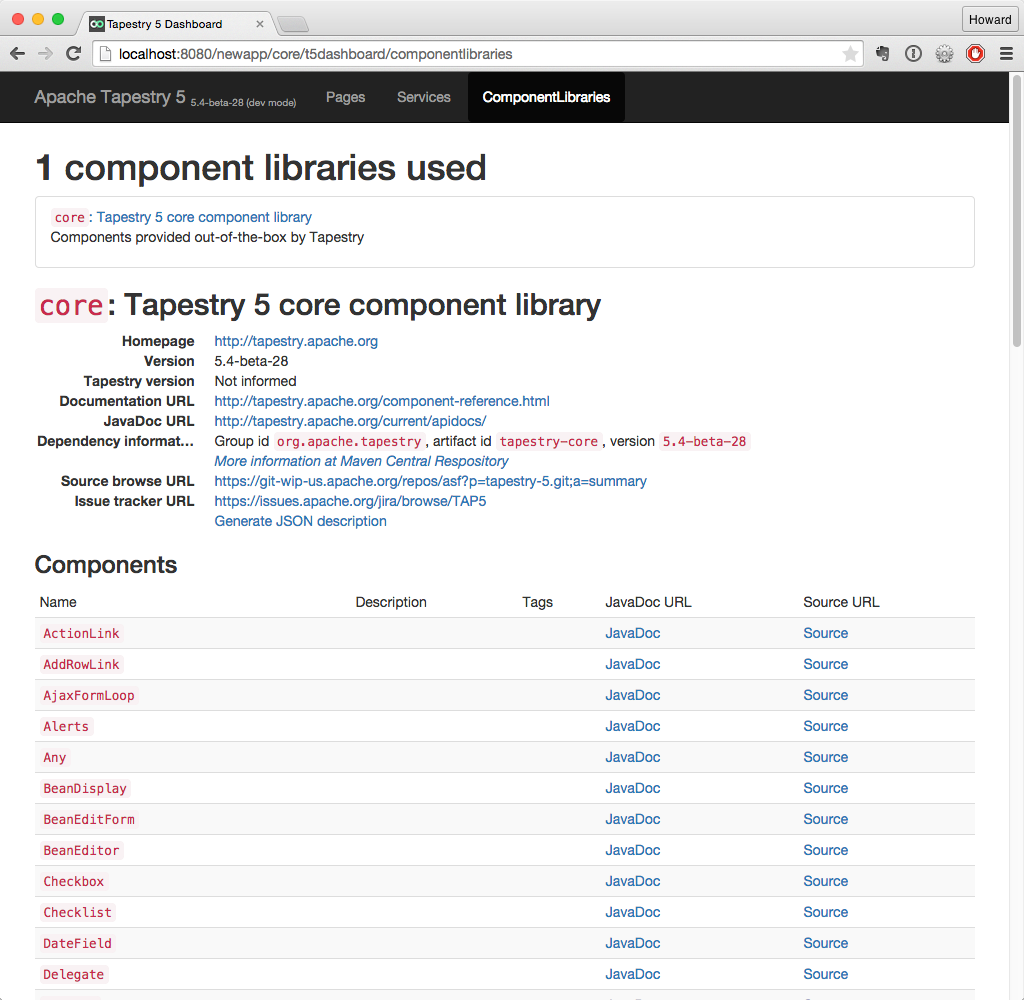
This page gives a summary of all component libraries used in the current application.