
There are of course a variety of debugging methods / options you can employ, but the easiest thing to do when getting going initially may be to turn on two key logging categories in your logging configuration file of choice. This example shows how to turn on debugging using log4j configurations:
log4j.rootLogger=DEBUG, A1

# A1 is set to be a ConsoleAppender.
log4j.appender.A1=org.apache.log4j.ConsoleAppender

log4j.appender.A1.layout=org.apache.log4j.PatternLayout
log4j.appender.A1.layout.ConversionPattern=%c{1} [%p] %m%n

log4j.logger.tapestry.globals.ResponseBuilder=DEBUG
log4j.logger.org.apache.tapestry.services.impl.DojoAjaxResponseBuilder=DEBUG
This simple configuration example should be enough to turn on an enormous amount of detail on the inner workings of the ResponseBuilder service. The global tapestry.globals.ResponseBuilder hivemind service should be a great place to apply the hivemind logging interceptor service. An example of applying the logging interceptor would be:
<implementation service-id="tapestry.globals.ResponseBuilder">
    <interceptor service-id="hivemind.LoggingInterceptor" />
</implementation>First and foremost, if you don't have the FireBug firefox extension installed - get it now. Using this plugin alone should give you a plethora of useful debugging information. Tapestry/Dojo also make good use of some of the core functionality exposed by this plugin in client side debugging facilities, so there is even greater incentive to check it out.
The logging facilities employed on the client side work in much the same way as the standard log4j style logging semantics many people are used to. The options for turning this kind of logging on / configuration can all be controlled through the Shell or ScriptIncludes components - whichever you use in your projects.
There are 3 core configuration parameters to these components that control the majority of logic here:
See the dojo docs for more information about logging, but the basic idea is that you can write statements like dojo.log.info("Doing some operation"); in javascript and have them appropriately filtered based on the log level.
The debug console is disabled by default. Currently known supported browsers are FireFox(having FireBug extension helps a great deal)/Opera/Safari.
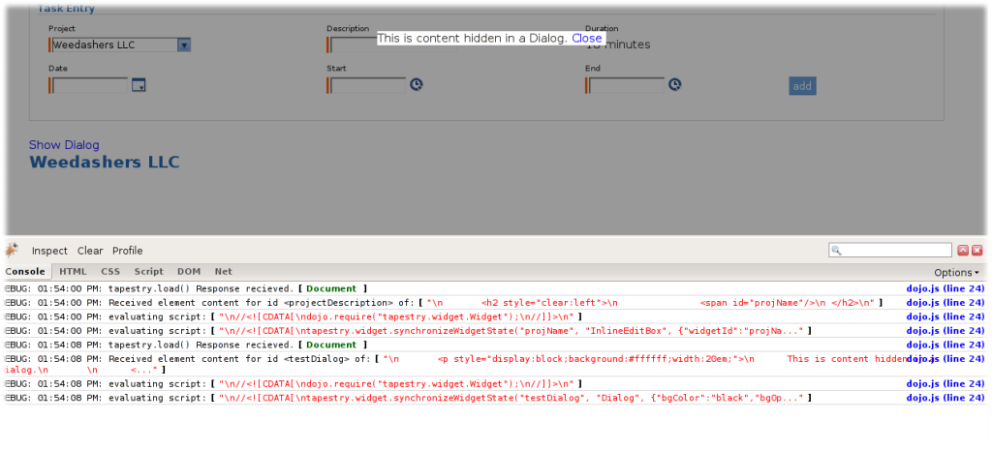
Following is a sample screenshot of the kind of debugging statements you'll find in debug mode from the TimeTracker demo.